1. Selection of DOM elements
if you familar with jQuery, select element is simlar $(‘.class’) or $(‘#id’). This construction is alias for document.querySelector. Commands kinds of $(‘tagName’), $(‘.class’), $(‘#id’) and $( ‘.class #id’) return the first DOM element, which coincides with the selector. In this case, if the document is available for the jQuery, its "$" will override this functionality console.
Here is another construction $$, which select all elements. Its use looks like $$(‘tagName’) or $$(‘.class’). This construction is alias for document.querySelectorAll.

2. The list of event handlers attached to an element
In the process of debugging you may need to find the event handlers attached to the elements. Use the console to make it very simple. Just use the following command:
getEventListeners($('selector'))
As a result of its execution will be given an array of objects that contains a list of events for which the element can react.
3 Event Monitoring
If you want to observe the occurrence of events that are bound to a specific DOM element, the developer console can help you. Here are some commands that can be used to monitor events:
monitorEvents($(‘selector’)) – it allows you to organize the monitoring of all events related to the items that match the selector. When an event occurs it will be recorded in the console . For example, command monitorEvents($('#firstName')) will enable log all events associated with the element whose ID - firstName.
monitorEvents($(‘selector’),’eventName’) – is similar to the previous one, but it focuses on a particular event. Here, in addition to the element selector function is passed and the event name. This command will bring in the data console on the occurrence of an event. For example, command monitorEvents($('#firstName'),'click') displays information only for the click event of the element with the ID firstName.
monitorEvents($('selector'),['eventName1','eventName3', ....]) – allows you to monitor several selected events. Here, the function is passed a string array that contains the names of the events. For example, this command: monitorEvents($('#firstName'), ['click','focus']) will display in the console information about the events click and focus for the element with the ID firstName.
unmonitorEvents($('selector')) allows you to stop the monitoring and event logging to the console.
4 Measuring the performance of a piece of code time (Timing)
There is a feature kinds of console.time('label') in the chrome console, which takes as an argument the tag and starts a timer. Another feature, console.timeEnd('label'), stops the timer that is assigned to it passed the mark. Here is an example of using these functions:
console.time('label1'); //start timer
var a = 0;
for(var i=0; i < 100000; i++){
  a += i;
}
console.timeEnd('label1'); // stop timer
// label1: 4.00 ms
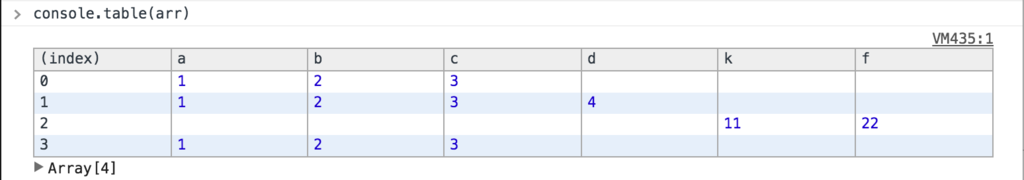
5 The output values of the variables in the form of tables
Suppose we have an array of objects:
var arr=[{a:1,b:2,c:3},{a:1,b:2,c:3,d:4},{k:11,f:22},{a:1,b:2,c:3}];
and you can use console.table(variableName) to print variable.
6 Inspect Element
Quickly jump to the element from the console by using the inspect($(‘selector’)) command. Commands like a $0, $1, $2, allow you to quickly jump to recently viewed items. For example, $ 0 will open the last scanned code element, and so on.
7 Display Element properties list
If you need to view a list of element properties, use this command:
dir($(‘selector’))